Graphing the Weather
 At the end of each month, it is pretty interesting for children to graph the weather in order to mathematically determine the frequency patterns of the previous month’s weather.
If you talk about the weather each day, you probably keep track of it, in some small way. Many teachers introduce tally marks (we will talk about tally marks at a later date) or a visual representation (a cloud, a sun, a snowflake) to mark the weather of the day.
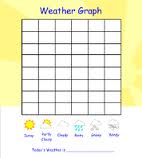
On the first day of the following month (or the last day of the current month), you can have the children sort the pictures of the weather into piles. They can put all of the suns together, all of the clouds together, and all of the snowflakes together, etc. You can then have other children count the piles. Using a chart like the one pictured above, you can show “how many” days it was sunny, how many days it was cloudy and so on. The children will be able to see very clearly, which weather had the most days, and which weather had the least days. You can take it further by counting how many more days there was sun than clouds, or vice versa.
If you want to take it to a whole other level, you can compare last month’s chart with this month’s chart. This will probably be quite challenging, since the visual clues will be harder to see, but counting and comparing is still possible.
Graphing is a good way to gather info on the weather and children can make comparisons from day to day or week to week.