Let’s Make Bar Graphs
posted by Chris Kruger
Welcome back to week 2 of making graphs with kids! Today we explore rolling out an exploration and pushing students to think more deeply about a concept.
Let’s Make Bar Graphs!
Since I knew the class had only limited exposure to bar graphs going into this exploration, we spent the first two weeks working on bar graphs. This blog will explain how I helped the class move from simpler to more complex graphing problems.
We started this exploration back in January, so I knew what my first question should be: did you like your presents or spending time with family? I knew this was a question the class would easily understand, have firm feelings about, and be excited to talk about. This conservatism is a key aspect my exploration philosophy: introduce novelty in small doses. If I am expecting them to do a completely new thing, then the rest of their thinking should be simple enough they can focus on the new piece. If I had asked them to vote on a conceptual topic, like their favorite character across multiple books, they would have been less able to focus on the graph.
The Rubber Meets the Road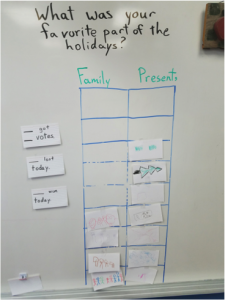
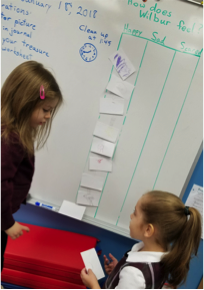
When it came to the actual voting, I had several goals for the process. I wanted to make sure the students couldn’t accidentally ‘vote’ multiple times, that they were able to express themselves through their votes, and to create a physical graph that could be seen and examined over time. Therefore, instead of asking the class to raise their hands, each student wrote or drew their vote on an index card. That card was then taped into a blank bar graph grid I created out of masking tape on our board. I also wrote out sentence stems for the class; while few of the students were able to read the stems, some of them decided to copy them into their exploration journals.
The timing of the voting and discussion was also rather important. The question was on the board from the time the students entered the classroom, which lead to big discussions about how people were voting and why. While this may have led to some politicking or vote changing, the point of the exploration was not to find out how they actually felt. Instead, they were learning to predict how people would vote, how that would change the outcome, and even making sure that everyone understood the question at hand. After all, when I hear one student say to another “Student Z hasn’t voted yet but will probably vote here, so we’re going to win”, that is a great sign that the student understands how to read and interpret a graph.
As the week went on, we transitioned from simple questions about their preferences to more complex questions about the novel we were reading, Charlotte’s Web. I also started encouraging the class to have more challenging discussions about the graph, like seeing how many people voted IN ALL, how much did this option win by, and what would have happened if two people had voted differently. These questions pushed the class to see the graph as a living representation, not a static object to be observed.
Ramping Up the Difficulty
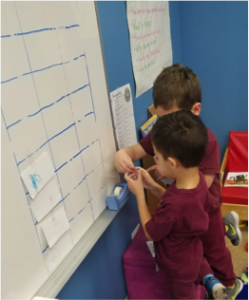
 In the second week I transitioned to more complex graphs. Instead of choosing between two options, the class had to choose between three or four. I also took away the horizontal guides so they could see how having the votes misaligned made the graph harder to read. Finally, the class switched from vertical bar graphs to horizontal bar graphs. In keeping with that conservatism I mentioned, the questions I posed to the class reverted to easier questions about who won and how many votes each option got until they became comfortable with these variables.
Throughout this entire process, I continually asked myself how these changes would either
help the class read graphs better or give the class a more intuitive understanding of the relationships between numbers. This helped me ensure the questions and graphs were challenging the class and working towards their mastery goals.
This was just the first half of our exploration, check back next week to see how we took it to the next level.
Will be using graphs in the classroom
I will continue to use graphs in the classroom.
I love using bar graphs in the classroom. I like the ones used in this video.
I like how graphing gives children a sense of accomplishment and importance on their stances.