Pictographs and Pie Graphs
posted by Chris Kruger
Pictographs and Pie Graphs
I’m going to start this week with a frank statement: I messed up this part of the exploration. When I was planning the scope of the exploration, I intended for the class to spend two weeks on bar graphs and two weeks on pictographs. I knew that pictographs are a struggle for students and I frankly didn’t have any idea how to implement pie graphs in a way that made sense. However, halfway through week 3, I realized how it could be done and altered the scope accordingly. I’m going to present the exploration as it actually went, but keep in mind if you’re teaching this that I would actually do pie graphs before pictographs, just because pictographs can be so challenging.
Pictographic nightmares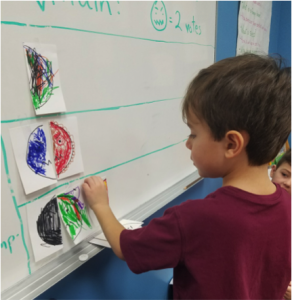
For as long as I’ve been teaching math, pictographs have been problematic. A pictograph appears simple enough, as it’s just a graph that uses pictures to represent the data (like a smiley face to represent a vote). However, students often struggle to interpret them correctly. This is particularly common because pictographs will often alter the key and make each image worth two or more votes. When this is the case, students will often count the pictures, not the votes. I knew, if I was going to teach this skill to my students, I would need a way to represent this to them and let them find ways to think through it.
I saw how the students appreciated being able to have their own index card and decorate their ballot in the first section. Therefore, I felt that tweaking the ballots but keeping that basic format would be appropriate. On the first day of pictographs, each ballot now came with half of a circle on both sides. The students then decorated each side to show which option they were voting for. When they attempted to cast the ballots by taping them up, however, I explained that each ballot needed to be connected to one of their classmates’ votes to make a whole circle. We also discussed how the last person might not be able to make a circle and what a ‘half’ of something means.
When it came time to talk, the class did surprisingly well. There was definitely confusion about the difference between how many CIRCLES were in a category and how many VOTES were in a category, but we talked through it. We also discussed why it was important to put the votes together into whole circles instead of leaving them floating around.
As the week went on, I provided less support when they were casting their ballots, which allowed them to talk together about how to combine their votes to create a whole picture. The class also talked about how important it was to color on both sides, since you didn’t know which side you would have to use on the board.
By Thursday I felt the class was ready for a greater challenge, so we transitioned from each picture taking two votes to each picture taking four votes. Once again, I simplified the questioning and provided more support, but the students adjusted smoothly and were able to vote with little support on Friday. Throughout this entire week, I kept many of the questions from
the previous two weeks, like which team won and how many people voted, while adding questions about how many pictures were created and how many votes it would take to finish a picture.
Pie Chart Parade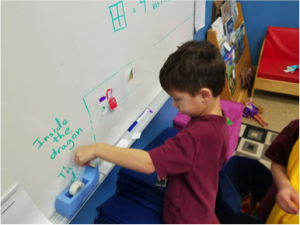
As I said at the beginning of this post, I really struggled with how to allow the students to create their own pie graphs, at least how to do them without the use of technology. After all, if one of the students was absent and didn’t vote, the pie chart would either need to have bigger slices or be left with a whole in it. Thankfully, I realized that I could create an ‘absent’ vote, which I would place when necessary. That hurdle overcome, I realized I was ready to start our final week of graphing.
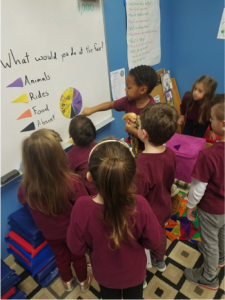
To make the pie graphs, I cut paper-plate sized circles out of multiple colors of construction paper and cut it into 12 equal pieces. I also traced a paper plate on the board to provide a template. The students would then pick a pie slice that matched the color of their vote (blue for dogs, red for cats, as an example). That pie slice would then be decorated and arranged on the template into ‘teams’. Our discussion afterwards centered on seeing which team had more votes, how many votes each team got, and how many people voted in all.
As the week went on, I transitioned into providing less guiding on placement, which led to a great discussion about why the teams needed to be together, and offering more options/colors. This week was actually far less challenging than the pictographs, which is why I would recommend switching them if you implement this exploration.
 Taking Stock
As we wrapped up our week of graphing, I felt the class had done a great job being able to compare numbers and read the data from graphs. I actually saw them going back and looking at the graphs we had already done and using their new understanding to think about them more deeply.
Next week, I’m going to wrap up the graphing exploration as well as provide some guidelines on how to structure an exploration. I hope you’ll join me then as we get ready to take what we’ve learned and start applying it to the classroom!
Great ideas.
Pictographs are a great way to provide children with data collection and analysis and get their brains working. They open up the mind to a lot of questions and ideas.
I really like the pie graph idea because it give the children something to think about and what different way to approach a pie graph.
I absolutely love doing pict-o-gragh after we have read a story or if we are discussing the weather. The children gain a greater sense of quantity during these activities.
Different ways to make graphs that I haven’t used.
New way to incorporate graphs
Pictographs are a great way to provide a great sense of quantity. For example when you are during a shoe graph. The children will get the point of the problem by seeing how many different colors that are on each line.
I really love doing pictographs, but right now I have a question? I work with the infants until they are 18 months. I would like to know is pictographs a little to much the them to learn.
I have had great outcomes using Pictographs with children has young as three. Even very young children can grasp the visual concept. I love that as children grow and their understanding expand the Pictographs can expand with them.
I have only used a little graphing in my preschool classroom and i am excited about trying pictographs
I have only used a little graphing in my preschool classroom and i am excited about trying pictographs…this site keeps telling me I have made this commen before but this is the fist time I have look at this blog site…
I love the idea of using pictographs to help children understand the concept of data collection!
Great idea. I am looking for more ways to use graphing in the classroom.
What a great new concept to introduce pictographs
and pie graphs to children. Will utilize in future curriculum.